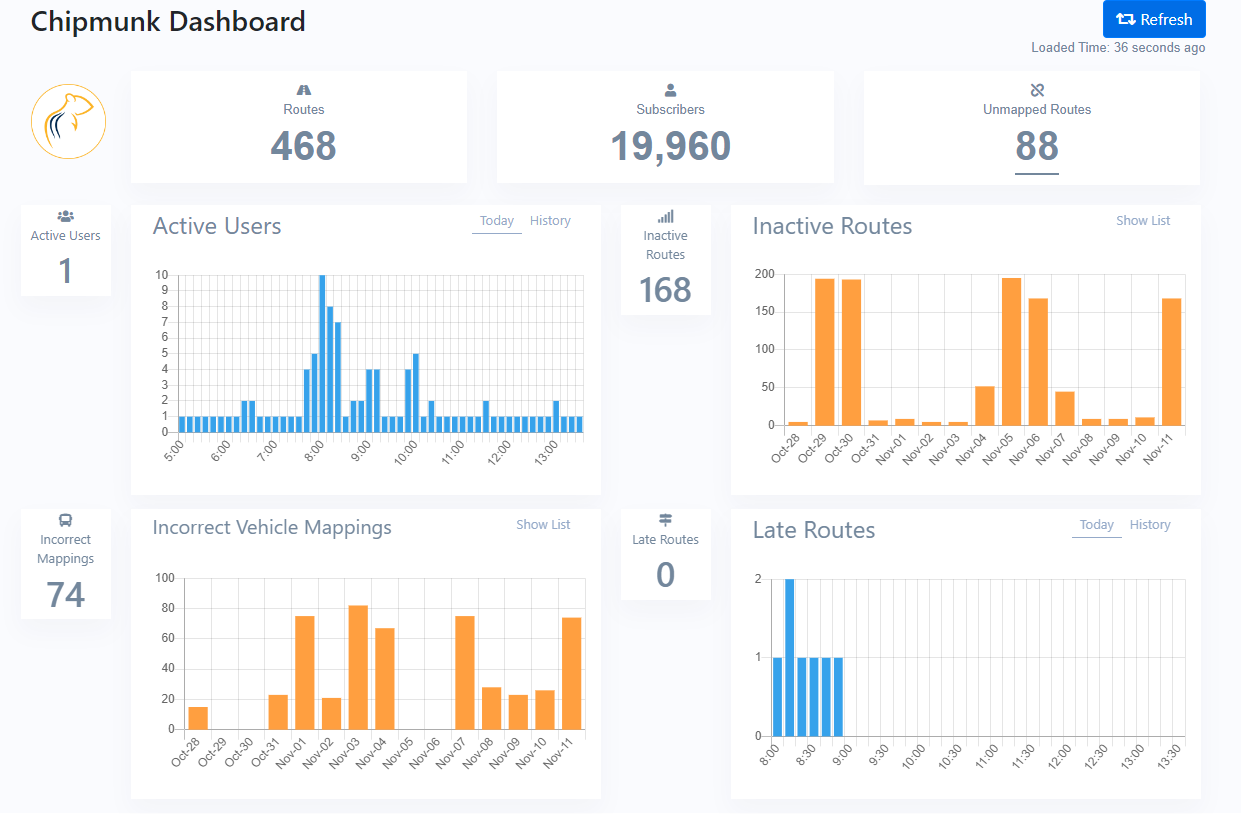
The Chipmunk Dashboard can be made available to Transportation users by enabling the TransportationChipmunkDashboard setting. The dashboard will then be visible under Site Administration Menu > Chipmunk Dashboard.

 Routes, Subscribers & Unmapped Routes
# of RoutesThe total number of routes that are tracked by Chipmunk. This is the number of routes that have the “Tracked by GPS” flag in the Route Manager in BusPlanner Pro checked off. If a route does not have this flag checked off, then they will not be included in this count, since Chipmunk is not tracking them
# of SubscribersThe total number of subscribers in the parent portal
# of Unmapped RoutesThe number of routes that do not have an active vehicle mapping in BusPlanner Pro
|
 Active Users
Active UsersThe maximum number of unique Chipmunk users during a certain time period. Active Users #The number of unique Chipmunk users in the last three minutes. Active Users Today GraphThis graph shows the number of unique Chipmunk users in the respective time period during the current day. The graph shows intervals of every ten minutes for the day up to this point. Active Users History GraphThis graph shows the number of unique Chipmunk users for each respective day for the last two weeks, including the current day’s count. |
 Inactive Routes
The number of routes with no movement events per day. For a route to be counted as an inactive route, a route must have had at least one event within the day, but none of the event(s) for the route that day so far have been a movement event. For an event to count as a movement event, the event type has to be something other than beacon or ignition off, and the event’s speed has to be greater than the “ETACalcMinSpeedForStop” setting in the tracker settings database (the default is 5km/h).
Once a route has a movement event for that day, they are removed from the count/list for the current day.
Inactive Routes #The number of unique routes that are considered inactive as described above for the current day. Inactive Routes GraphThis graph shows the number of unique routes that are considered inactive as described above for each day for the last two weeks, including the current day’s count. Inactive Route ListThis list shows a listing of the unique routes that are considered inactive as described above for the current day. |
 Incorrect Vehicle Mappings
The number of routes with seemingly incorrect vehicle mappings. A vehicle mapping is seen as incorrect if the bus is more than 10 km off the planned path. However, if the bus has serviced more than 40% of the stops on the current run, then the route will not be counted as an incorrect vehicle mapping. If a route in the incorrect vehicle mappings count/list is corrected, the route will be removed from the count/list for the current day. Incorrect Vehicle Mappings #The number of unique routes that are considered to have an incorrect vehicle mapping as described above for the current day. Incorrect Vehicle Mappings GraphThis graph shows the number of unique routes that are considered to have an incorrect vehicle mapping as described above for each day for the last two weeks, including the current day’s count. Incorrect Vehicle Mappings ListThis list shows a listing of unique routes that are considered to have an incorrect vehicle mapping as described above for the current day. |
 Late Routes
The number of routes that are currently/have been late for more than 15 minutes. Once a route is added to the count/list for that day/time period, then that route will always be in the count for that day. This is so that we can keep track of routes that were late at any point during that time period. Late Routes #The number of unique routes that are considered to be late as described above in the last three minutes. Late Routes Today GraphThis graph shows the number of unique routes that are considered to be late as described above in the respective time period during the current day. The graph shows intervals of every ten minutes for the day up to this point. Late Routes History GraphThis graph shows the number of unique routes that are considered to be late as described above for each respective day for the last two weeks, including the current day’s count. |